Push Polling

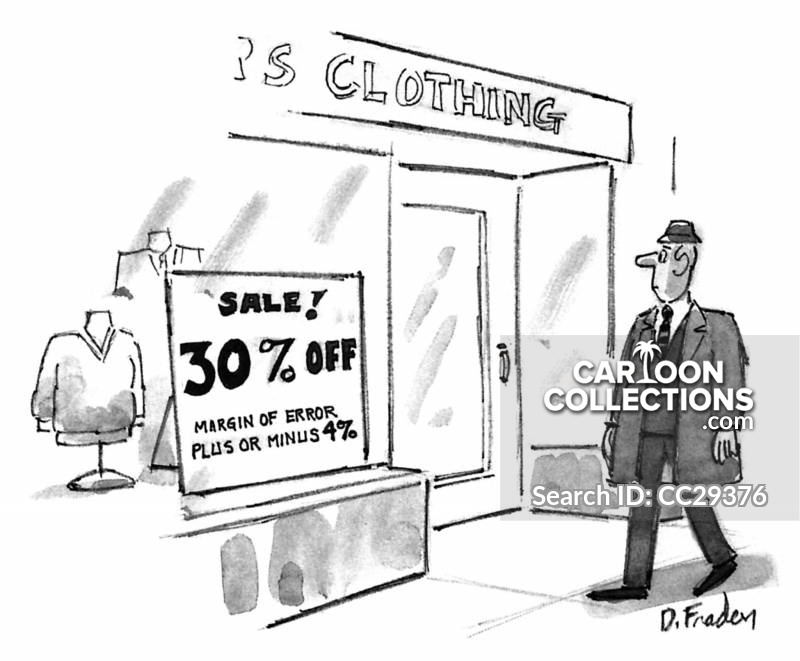
Back in December I wrote a blog piece on polling (evenabrokenclock.blog/2020/12/02/poll-dancing/). That piece discussed the mathematical nature of polling, and the uncertainty that goes into a scientifically-designed poll. It mentioned 3 criteria that are required for a poll to provide valid estimates of the sampled population. Those criteria were:

  • Those polled are a representative sample of the population
  • Those who respond to polls are honest in their answers
  • The technology used to reach those who are sampled matches the technology used by those who are sampled.

And then, there was the poll I responded to last week. Since I am a resident of West Virginia, and apparently we have the nation’s most powerful Senator from our state, we’ve been subjected to a great deal of political advertising even in this, a non-election year. This polling is an extension of the advertising, in that it is overtly trying to influence the population being polled.

I was asked about the filibuster. I was asked whether I favored the majority of the Senate being able to ram their opinions over those of the minority by a simple majority. Just the way the question was phrased made me positive that I was being pushed into answering negatively, so of course I switched from an honest response into the mode where I was going to be opposed to the position being pushed upon me.

Next came the questions on support for HR1. There the premise was that by supporting that bill, I would automatically favor the enfranchisement of murderers and rapists, and of “illegal aliens”. No subtlety in this poll, that’s for sure. Where the question on murderers and rapists had to do with ensuring that felons who have completed their sentences have the right to vote restored, the nature of the question led me to believe that this act would allow those in prison presently to access the ballot. Likewise, the mandating of opt-in for voter registration as part of such governmental interactions as drivers licensing is being portrayed as the way for mass registration of ineligible voters who would then vote for Democrats en masse. In my state of West Virginia, the opt-in approach was approved in 2016. It has yet to be implemented, and this year legislation was approved to go back to having the default option being opt-out. Amazing how this works, if you ignore the law for long enough, it disintegrates and blows away in the wind.

I can only hope that the “results” of this poll are buried deeply within the bowels of whatever dark money entity commissioned the poll. For these are the real intentions of this type of polling. They wish to keep the ability to hide the origins of their financing from the public they are trying to hoodwink. The prohibitions against dark money staying buried under the rocks of financial entanglement are dear to the heart of the conservative industrial complex. Likewise, the requirement to take the power to draw their districts away from Legislators and give it over to a non-partisan group will remove the ability of legislators to take a 50/50 split in votes and turn it into a 2/1 majority through creative drawing of district boundaries.

I’m not certain I am in full agreement with all of the provisions of HR1. But I am certain that continuation of the status quo will be ruinous towards the continuation of this experiment in representative democracy. When one side uses their power to stack the deck in their favor, it eventually causes those on the outs to view the process as being illegitimate. Do this enough times, and you will be surprised by the response of those who view themselves as being occupied by an opposing force that refuses to accept their worth as humans.

Poll Dancing

Image from Cartoonstock.com

Ok, it is time to talk polls. For the second Presidential election in a row, the lack of accuracy from major polling services has been an issue. Before the election, there was skepticism expressed by many, since the predictions of a blue wave as detected by the polls did not match the gut feelings of people on the ground, especially in those states declared to be battleground states. It is always difficult to determine the slope of a line with less than three data points, but in this case, since presidential polling only gets tested every four years, it is appropriate to declare a trend and try to understand why it is occurring. In this regard, I have no knowledge about the internals that polling firms have seen. I am only looking at trends in society in general, and extrapolating them to the polling results.

First, polls are very valuable in estimating the characteristics of a large population, if three criteria are met. Those criteria are:

  • Those polled are a representative sample of the population
  • Those who respond to polls are honest in their answers
  • The technology used to reach those who are sampled matches the technology used by those who are sampled.

The first and third criteria are closely interrelated. Since most polling still depends upon land line responses, the audience for polling is becoming further and further divorced from the population as a whole. That is because fewer and fewer people use a land line, but instead are totally dependent upon their cell phones. If you look over the past decade, the growth of cell phone penetration has been explosive. And another factor that comes into play is that many people automatically disregard phone calls from an unknown number. So if you attempt to contact people on cell phones, you are likely to be ignored by an increasing percentage of the population. Finally, once you have answered the phone, you have the opportunity to opt in to being polled. I normally will opt in unless I am in the midst of doing something else and can’t split my attention. But I would be interested to see if there is a difference in behavior between those who lean left and those who lean right in terms of voluntary opt in percentages. Since so many of those on the right politically now distrust the government and the established elites, my sense is that more people on the right will decline to participate in a survey.

The second criteria, being honest in their answers, is the most subtle factor in determining whether a poll is accurate. Sometimes folks just want to throw a monkey wrench into the works, and so they will deliberately answer inaccurately in order to influence the results. The number who choose this option may be small, but when you are trying to assess a smaller population (like a state), the smaller sample size means each response is proportionally more important. So it can appeal to those who feel powerless in society to try to exert more influence on polls than normal by screwing with the results. For this to affect polling accuracy, it would mean that more people on one side of the electoral continuum would use this than those on the other side. Sounds like a good project for a social scientist to take on over the upcoming years.

Why has polling been so heavily used over the past few decades? Because it worked. When the US was a more homogenous nation, and we all shared a common communications technology (the telephone), it was possible to ensure that you could select a random slice of the population. Call someone up, have them answer a few questions regarding age, sex, and race, and you could slot them into one of the acceptable demographic categories for a poll. In case you haven’t noticed, we no longer fit neatly into categories as we used to. And the longer we go with alternative communications technologies, the further we stray from the easy-to-sample population we had from the 50’s through the 90’s.

Now, as to how the polls are used, you have to stray into the world of mathematics. One of the most common terms you hear is “Margin of Error”. That phrase is bandied about by the Steve Kornacki’s of the cable world along with many others of the pundit class. The formula for margin of error is this:

The margin of error in a sample = 1 divided by the square root of the number of people in the sample

This is what is amazing to understand. It doesn’t matter what is the size of the population being sampled, it only matters what is the size of the sample. That is why having a representative, but random sample of the population is so important. Incidentally, for a +3% margin of error, the sample size would need to be 1090. For a +5% margin of error, the sample size would need to be 400. Usually national samples are larger in order to ascertain valid statistics for subgroups (male, female, white, black, age groupings). But if just the top result is desired with a +3% margin of error, it is possible to sample the entire population of the US with a sample size of slightly over 1000 individuals. This is the magic of polling.

When someone speaks about the margin of error being +3%, what that means is that you would expect the true value for the population to be equal to the sampled value, +3% for 95% of the time. The 95% is a standard confidence limit in statistics, used often to determine if an effect is real or may be just a chance result. So if someone shows a poll support of 45% with a margin of error of +3%, then we would expect the real value to be within 42% to 48% for 95% of the time. If two candidates are being sampled, you look to see if there is any overlap between the 95% confidence intervals for the two. In this case, if candidate A had 45%, and candidate B had 49%, there would be some overlap between the 95% confidence intervals for the two. The range from 46% to 48% would fit both of these candidates. Now, if there is only slight overlap between the two, it is more likely that the one who samples higher is truly ahead, but it is not outside of the standard of 95%.

The 95% confidence interval is used many times in science. It is used in testing of drugs and medical treatments. I used it in production trials in a chemical plant, when we were attempting to determine whether one set of conditions was better than another. Once you are familiar with the math behind sampling, you can use that math in many different ways.

But once again, it all depends upon whether the population that responds to a survey is truly a representative sample of the population as a whole. It seems obvious that at least in the US, there is something wrong with the methodology used to select a random, representative sample. It remains to be seen whether these problems can be diagnosed and fixed before the next huge use of polling coming up in 2024.