
It’s a puzzlement. How is it that the same set of facts can be perceived in diametrically opposite ways? How is it that some folks can see the Mueller investigation laid out credible allegations of behavior by the President and his administration that not only skirted the law, but often trampled it in the dirt? At the same time, other folks believe that since no indictments are proceeding directly from the investigation, it represents a total and complete exoneration of all of the behavior seen from this administration?
Meanwhile, the behavior of the tweeter in chief has not significantly changed from the behavior seen during the campaign and in the transition period leading up to his inauguration. One of the first posts in my blog was on the exponential decay curve, and how it applied to the effectiveness of Trump’s tweets. I am reprinting it in this post, as this one post keeps getting people reading it long after I posted it in March 2017. I am bringing it up again because we are seeing evidence that the decay curve for the effectiveness of Trump’s tweets is performing as predicted. I just thought that the rate of decay would be much greater than it has been. But recent publications have shown that indeed, the effectiveness of Trump’s tweets has decreased in a manner very similar to the exponential decay curve in my post. See this post on Axios from May 26 of this year:
https://www.axios.com/president-trump-tweets-engagement-4c6067a8-734d-4184-984a-d5c9151aa339.html
Here is the chart that the post references. It shows the percentage of those who retweet or like a particular tweet as a percentage of his followers. Note how closely the graph follows the exponential decay curve shown in the original post.
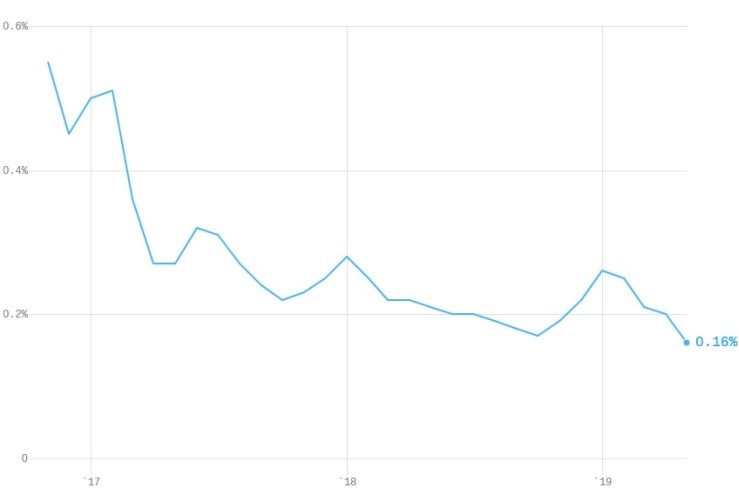
Assuming that retweets and likes are reflective of the effectiveness of his posts is a verifiable measure of the impact that any individual tweet has. Sometimes it is good to see that a prediction you make is coming true, even though we have all had to suffer a great deal in the intervening period. The one correction I would make is that it seems like the half life of a Trump tweet is about 14 months, not the 2 months I originally predicted. I was too optimistic at the start of this administration.
The following post was put up on March 28, 2017. You can link directly to it here:
Exponential Decay Curve in Politics
Today’s topic concerns exponential decay curves. This is what happens when “something” declines over time. A classic exponential decay curve is shown here:
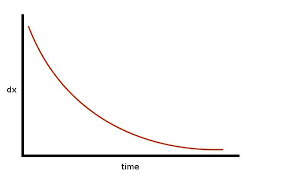
Exponential decay curves are often found in nature. The classic one that is taught in classrooms concerns radioactive decay. For a given radioactive isotope of an element, the half-life of the isotope determines the shape of its decay curve. A half-life is defined as the amount of time for 1/2 of the radioactive decay for an isotope to have occurred. This can vary among isotopes from fractions of a second, up to 4 billion years in the case of Uranium 238. Half-lives are very important when calculating the potential radiation exposure to a radioactive isotope. Isotopes like Cobalt 60 are powerful radiation sources that are used industrially to examine welds and metals for defects. They provide plentiful gamma rays since the half life of this isotope is only 5.3 years. That is why there is concern about the use of this isotope in a dirty bomb, since the radiation from an explosive dispersal of Cobalt 60 would cause significant exposure to high powered gamma radiation.
Exponential decay curves may be found in other natural and also artificial systems. A new example of an artificial system that appears to be following an exponential decay curve is the Presidential tweet. The response to a Presidential tweet appears to be following a typical decay curve function. It is too early to get an accurate measurement of the half-life of tweet effectiveness, but a preliminary estimate is that the half-life of the response to a Presidential tweet is about two months.
Since this system of Presidential tweets is an artificial system (one not normally found in nature), it is uncertain as to what the response of the originator of the Presidential tweets will be to an ongoing decrease in tweet effectiveness. Most observers believe that the originator will greatly increase both the frequency and objects of tweets so as to continue to receive a total response to the tweets that approximates the effect of the first tweets.
However, it is nearly certain that since the effectiveness of any individual tweet will continue to decline, eventually the response to all Presidential tweeting may approach zero. There is a school of thought though, that maintains the belief that we may begin to see an inverse function develop for the tweet response. That is, instead of receiving a positive response to tweets, each subsequent tweet may result in a negative response. It is possible that the magnitude of the negative response may increase with additional tweets, so that Newton’s third law may be given a test in the political arena. For every action, there is an equal and opposite reaction. Observers of politics will be watching this process with rapt attention.

That first paragraph seems out of place in the discussion of the exponential curve applied to presidential tweets, but deserves elaboration. There sure seems to be a bifurcation in epistemology between the “believers” and the “skeptics”, between the religious types and the scientific types. Trump is so good at exploiting the gullibility of the “believers” that it makes my hair itch. And yet the obvious lack of survival advantage in believing falsehoods requires explanation. Maybe it is an artifact of human culture where the “selective pressure” of memes is far more forgiving than the selective pressure of nature. A body of interrelated “fake facts” can be sufficiently internally consistent that, within that ideational ecosystem, there is no “punishment” for falsehood.
Meanwhile, here is a related and somewhat amusing true story:
The owners of a full-scale replica of Noah’s Ark in Kentucky are suing their insurance company for rain damage. The biblical literalists who own the Ark Encounter exhibit, a 510-foot-long “sister attraction” of the nearby Creation Museum, claim they suffered “tortious injury” to the tune of $1 million when their insurers failed to adequately compensate them for the damage done by recent “heavy rains.”
LikeLike
A tweet is something you hear in your head, when you’re going insane. Surely not Mr Trump………..
LikeLike